Rendering 3D with School Math (and ThorVG) — Part 1
I stayed away from computer graphics for years because of the math I thought it requires. Then one video showed me it was school trigonometry all along. So I projected a space station onto a 2D canvas and let ThorVG's new web canvas API draw the faces.
I came across a video by Carl the Person explaining how to render a 3D object on a screen. The from-scratch kind: no OpenGL, no game engine, just points and a canvas. A few minutes in, I realized something uncomfortable: I already knew all the math it needs. Basic school trigonometry. Sin, cos, similar triangles. That’s the whole entry ticket.
I stayed away from graphics for years because I assumed the math was above me. Nobody told me the door was unlocked.
So I did the obvious thing: rendered a spinning cube on a plain HTML canvas and felt very proud of myself for one evening. Then I wanted to push it further. I work on dotlottie-rs at LottieFiles, and ThorVG is the vector engine underneath it. ThorVG recently got a web canvas API, so the plan became: project a real 3D model onto a 2D canvas using nothing but school math, and let ThorVG draw the faces.
But first, let me walk through the math real quick. It’s short, I promise.
The whole trick
To render a 3D object on a 2D canvas, you take every 3D point of the object and project it onto an imaginary 2D plane, the projection plane, which sits some distance n in front of a virtual camera. Like taking a photo of the object.
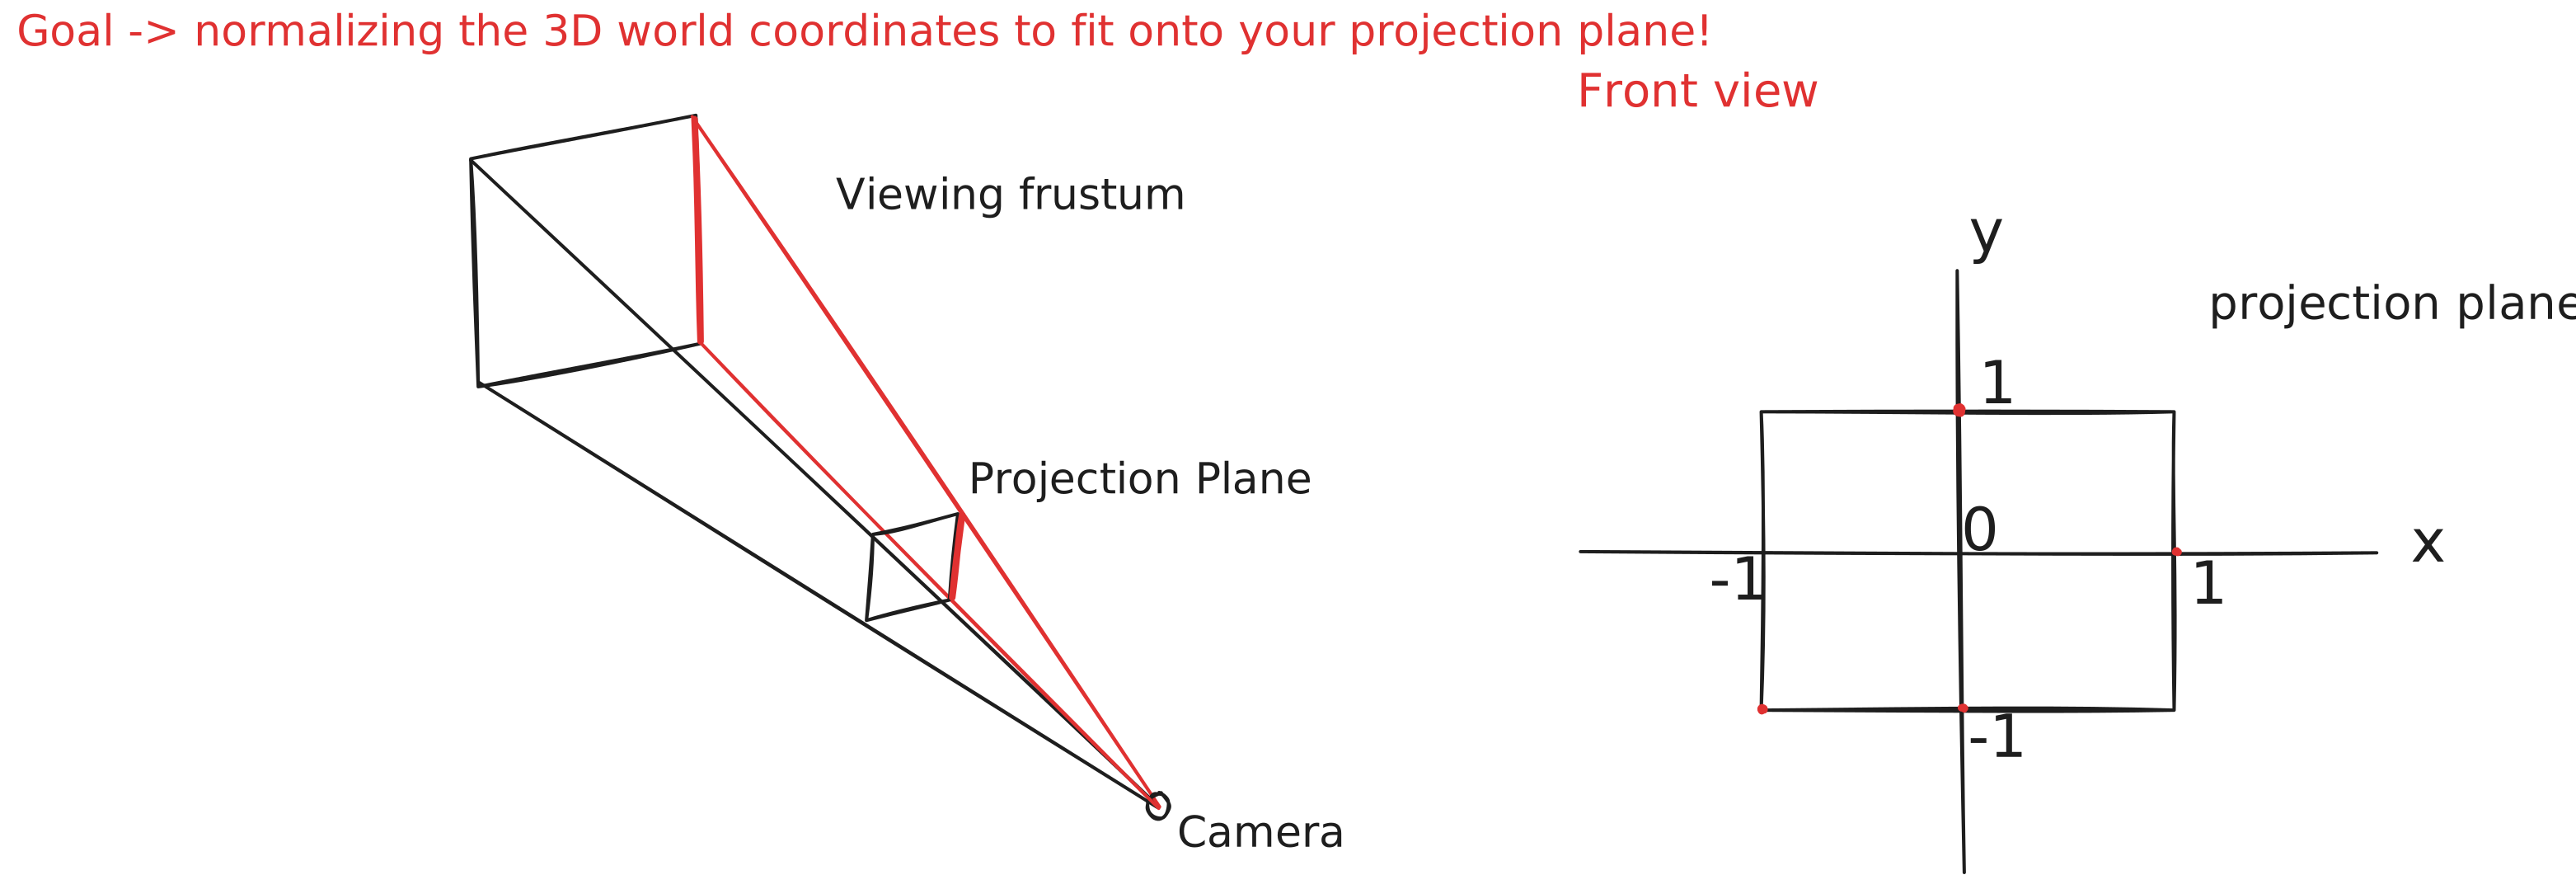
Then, because the projection plane and the canvas don’t agree on anything (the plane’s origin is its center, the canvas origin is its top-left corner, and their sizes are different), you translate every projected point into actual canvas pixels.
That’s the entire renderer. Two functions. Let’s build them, easy one first.
The easy half: from plane to pixels
We give the projection plane a fixed, normalized size: from -1 to 1 on both axes. This little decision simplifies everything, because the projection math never needs to know how big your canvas is. The same projected points can be scaled onto a 600px canvas or a 4K screen later.
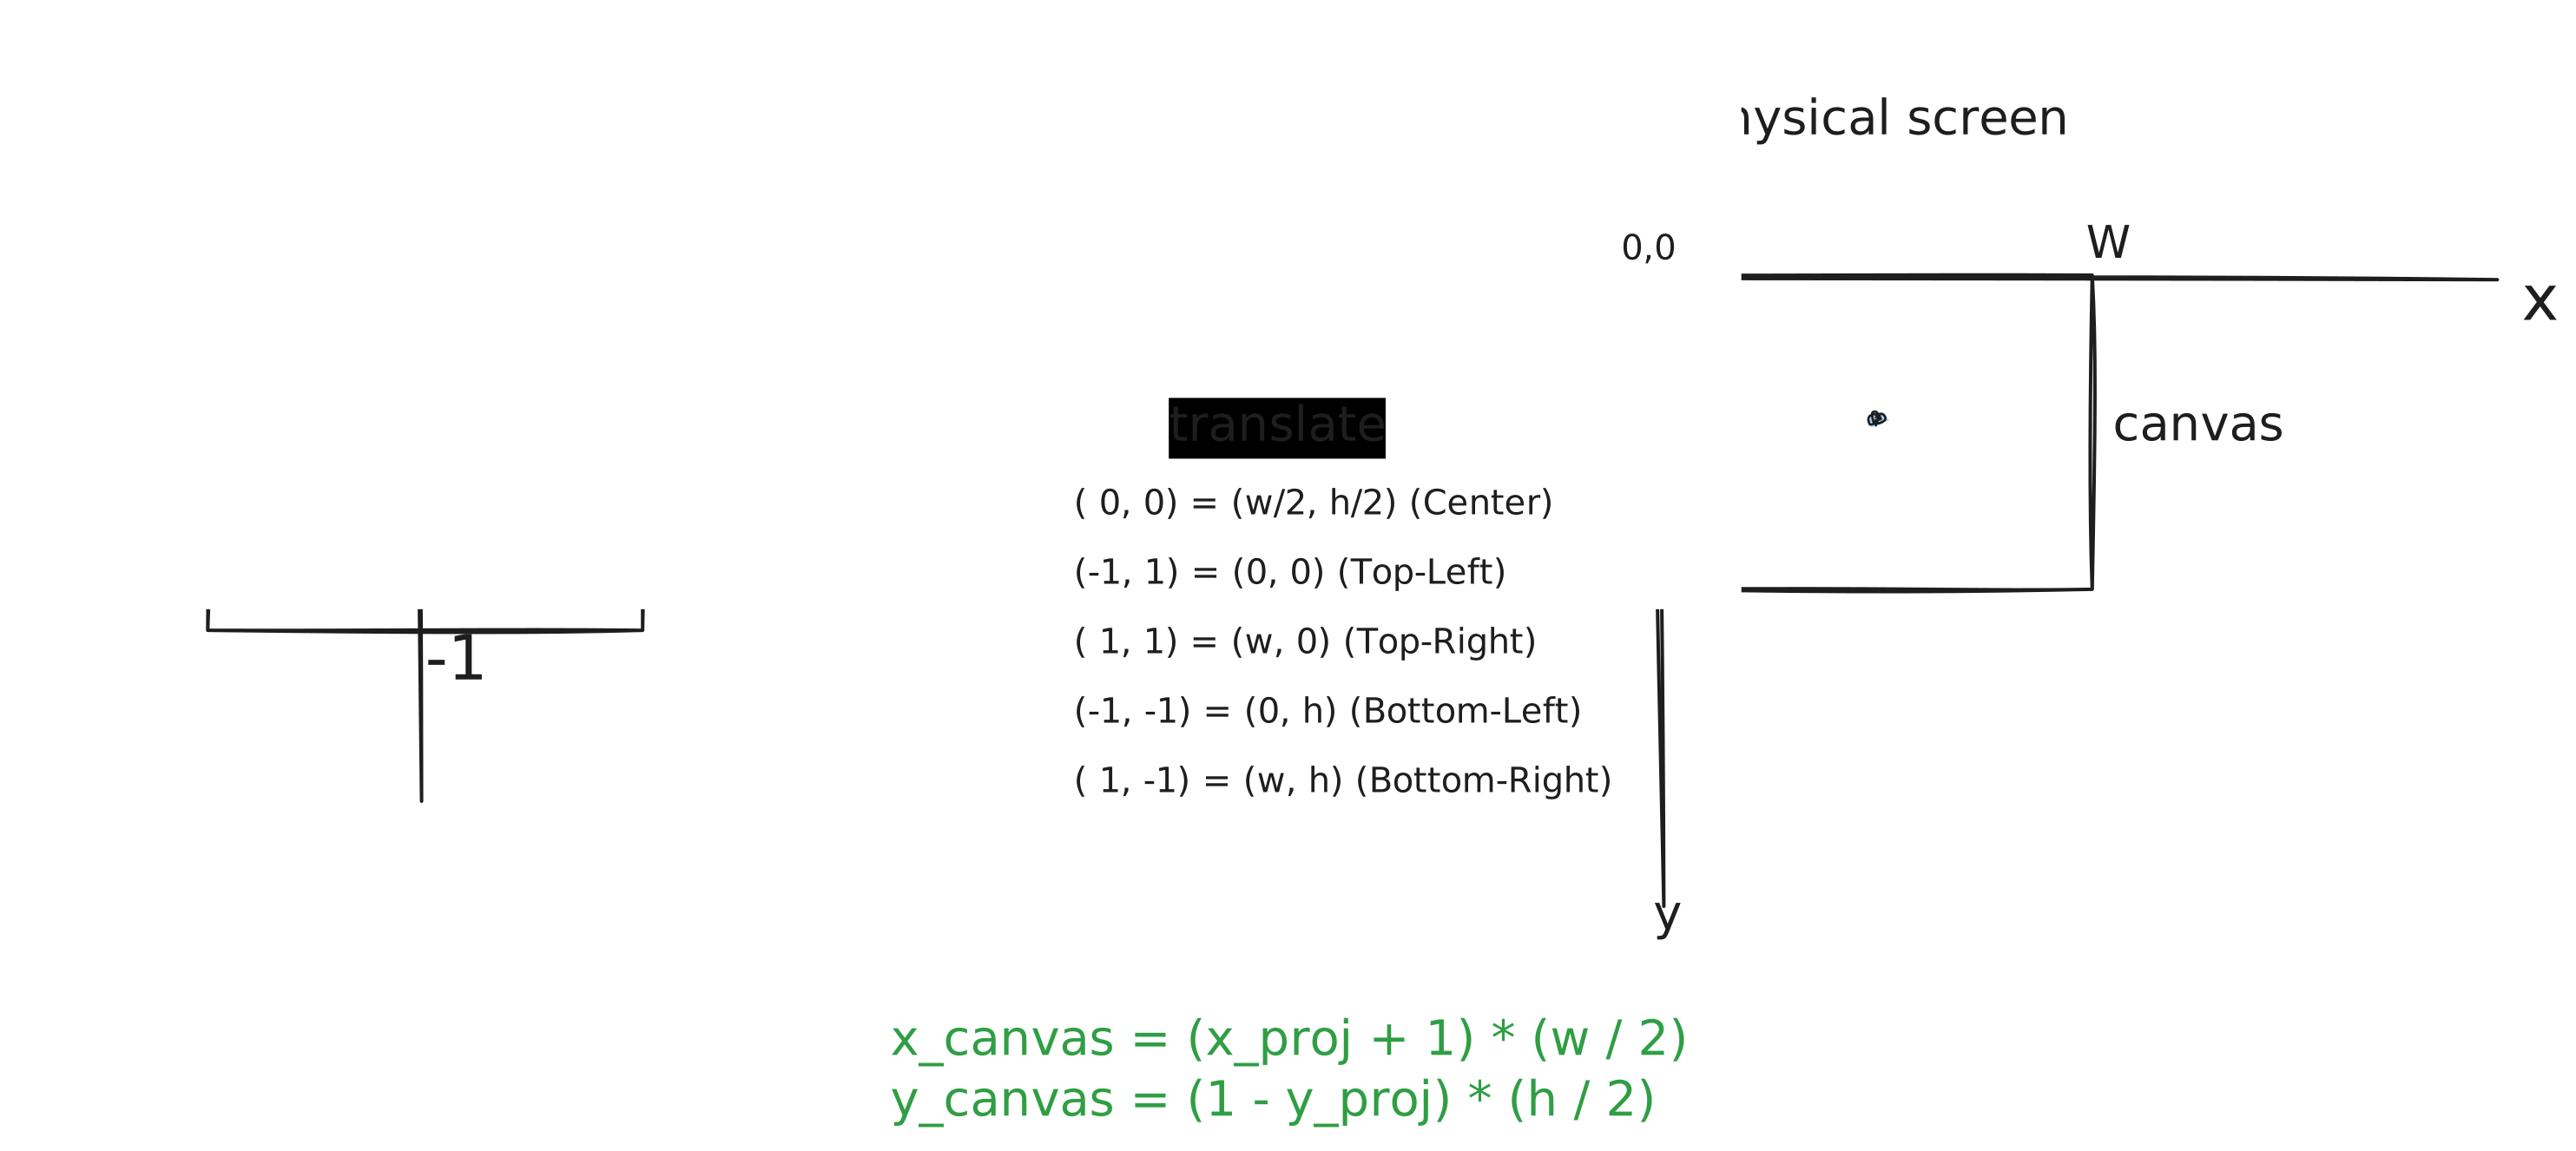
For x we shift [-1, 1] into [0, 2] and scale it by half the canvas width. For y we do the same but flipped, because in math y grows up, while on a canvas y grows down.
The projection
Now the actual projection. Here is a side view of the setup, looking at it along the x axis:
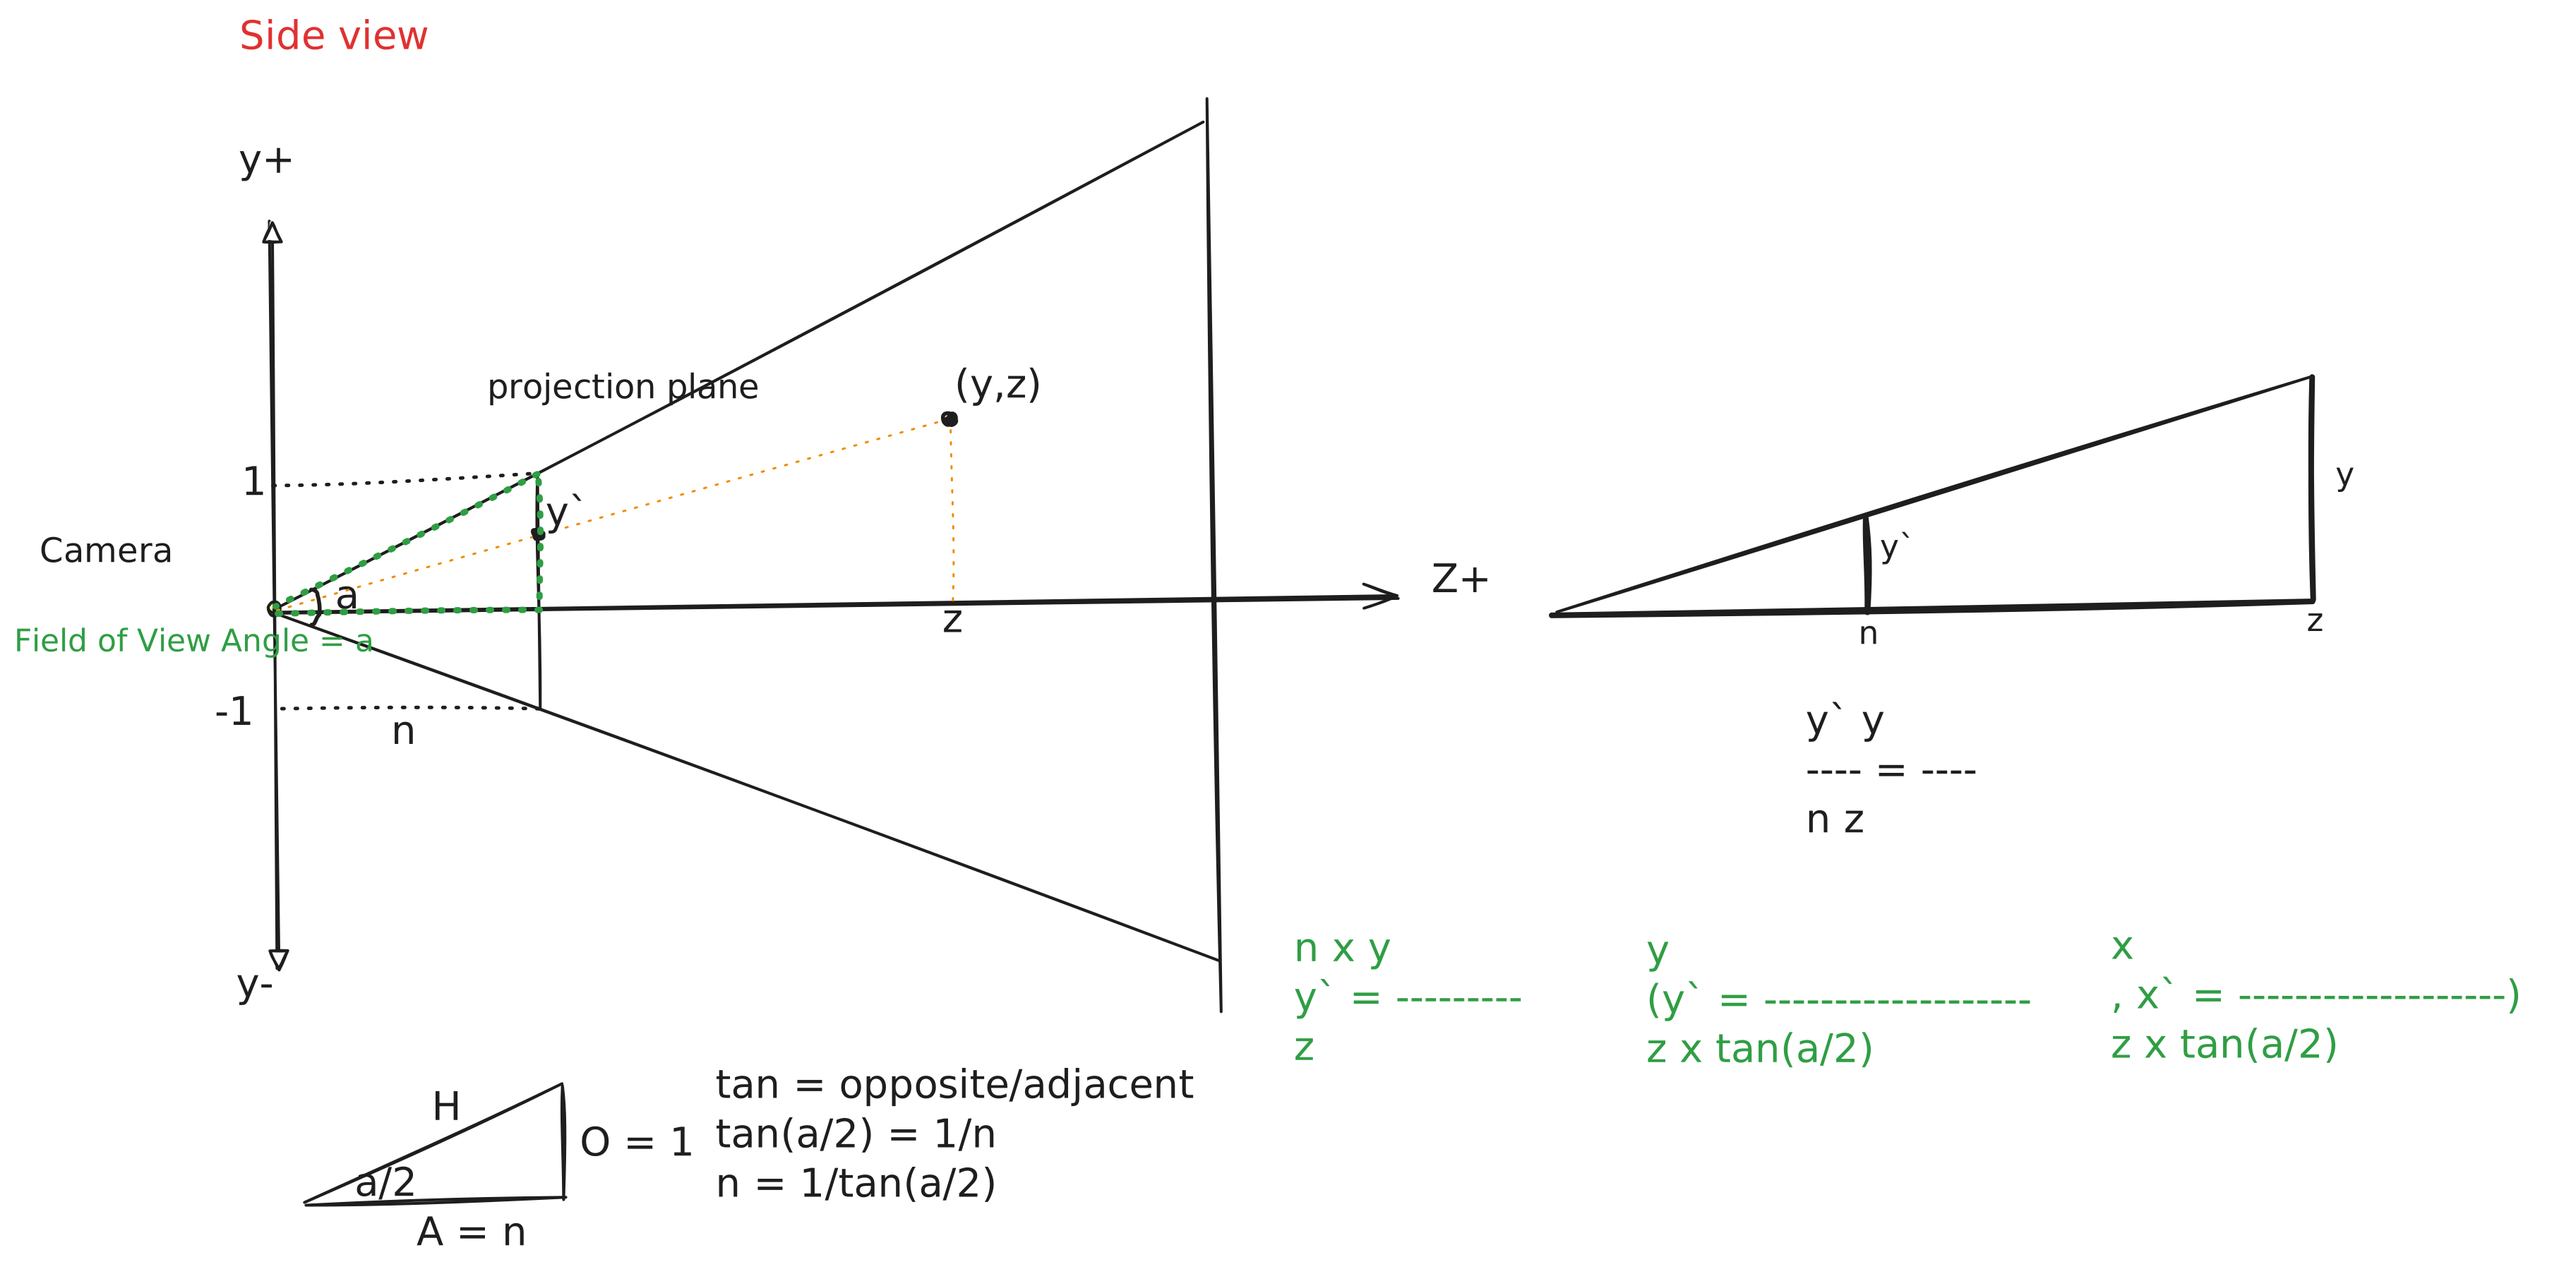
The camera has a field of view, the angle a. The plane sits n away from the camera, and we already fixed its half-size to 1, so a right triangle shows up: tan(a/2) = 1/n.
Then I cheated. I picked a field of view of 90°, because tan(45°) = 1, which makes n = 1 and the whole term disappears. When you build things for fun, you’re allowed to pick the numbers that delete your homework.
What’s left are the two similar triangles in the figure: y'/n = y/z, and since n = 1:
y' = y / z
x' = x / z
The farther a point is (the bigger its z), the more it shrinks toward the center. That’s all perspective is. Railway tracks look like they meet in the distance because of one division. Pretty simple, ha!
Here are both functions, the entire “engine” of this blog post:
// project a 3D point onto the projection plane
function project(point3d) {
    return {
        x: point3d.x / point3d.z,
        y: point3d.y / point3d.z,
    };
}

// translate a point from the projection plane to canvas pixels
function toCanvas(point2d) {
    return {
        x: (point2d.x + 1) * (WIDTH / 2),
        y: (1 - point2d.y) * (HEIGHT / 2),
    };
}
Now the fun part: drawing with ThorVG
We need a model that deserves the effort, so instead of my cube I grabbed a space station in OBJ format. An OBJ file is mostly two lists: vertices, the 3D points, and faces, where each face is three indices into the vertices list saying “connect these three points into a triangle”.
const raw = await fetch("/blog/3d/space_station.obj").then((res) =>
    res.text(),
);

const model = new OBJFile(raw).parse().models[0];
const vertices = model.vertices; // [{ x, y, z }, ...]
const faces = model.faces.map(
    (face) => face.vertices.map((v) => v.vertexIndex - 1), // OBJ counts from 1
); // [[i1, i2, i3], ...]
Two helpers before we draw anything. The model’s points sit around z = 0, and project() divides by z, so we push the whole thing 15 units away from the camera first, otherwise the math explodes. And we rotate it every frame, so we can actually tell it’s 3D. Rotation looks like the scary part, and it’s again just sin and cos:
function translateZ(point3d, dz) {
    point3d.z += dz;
    return point3d;
}

function rotateXYZ(point3d, angle) {
    const sin = Math.sin(angle);
    const cos = Math.cos(angle);

    // around x — x stays put, y and z spin
    let x1 = point3d.x;
    let y1 = point3d.y * cos - point3d.z * sin;
    let z1 = point3d.y * sin + point3d.z * cos;

    // around y — y stays put, x and z spin
    let x2 = x1 * cos + z1 * sin;
    let y2 = y1;
    let z2 = z1 * cos - x1 * sin;

    // around z — z stays put, x and y spin
    return {
        x: x2 * cos - y2 * sin,
        y: x2 * sin + y2 * cos,
        z: z2,
    };
}
Setting up ThorVG’s web canvas takes a few lines. It loads a WASM build of the engine and attaches it to a normal <canvas> element:
const TVG = await ThorVG.init({
    renderer: "gl",
    locateFile: (file) =>
        `https://unpkg.com/@thorvg/[email protected]/dist/${file}`,
});

const canvas = new TVG.Canvas("#canvas", {
    width: WIDTH,
    height: HEIGHT,
});
Before touching the faces, let’s draw the vertices as plain dots and see if the math even works. Every frame: rotate, push, project, translate, draw.
function drawPoint(p) {
    const dot = new TVG.Shape();
    dot.appendCircle(p.x, p.y, 2, 2);
    dot.fill(255, 255, 255, 255);
    canvas.add(dot);
}

let angle = 0;
function render() {
    angle += 0.01;
    canvas.remove(); // clear the previous frame

    const points = vertices.map((v) =>
        toCanvas(project(translateZ(rotateXYZ(v, angle), 15))),
    );

    for (const p of points) drawPoint(p);

    canvas.update();
    canvas.render();
    requestAnimationFrame(render);
}
requestAnimationFrame(render);
That is a 3D space station spinning on a 2D canvas, as a cloud of dots. When this first showed up on my screen I just sat there staring at it for a minute.
Now the faces. Same loop, but instead of a dot per vertex, we draw a small shape per face: move to the first point, line to the second, line to the third, close the path, fill it.
function drawFace(p1, p2, p3) {
    const face = new TVG.Shape();
    face.moveTo(p1.x, p1.y);
    face.lineTo(p2.x, p2.y);
    face.lineTo(p3.x, p3.y);
    face.close();
    face.fill(255, 255, 255, 255);
    canvas.add(face);
}

// and inside render(), replace the dots loop with:
for (const [i1, i2, i3] of faces) {
    drawFace(points[i1], points[i2], points[i3]);
}Every face gets the same white, so the station renders as one solid white shape that keeps changing while it rotates. If you swap the fill for a thin stroke, you get the classic wireframe look instead. The button under the demo does exactly that, with one small confession: my first wireframe stroked each face as its own shape, exactly like drawFace above, and it dropped to about half the frame rate. So the wireframe you’re looking at cheats a little. All ten thousand outlines go into one single shape, and ThorVG strokes the whole thing in one go:
// wireframe: every face becomes a sub-path of ONE shape
const wireframe = new TVG.Shape();
for (const [i1, i2, i3] of faces) {
    wireframe.moveTo(points[i1].x, points[i1].y);
    wireframe.lineTo(points[i2].x, points[i2].y);
    wireframe.lineTo(points[i3].x, points[i3].y);
    wireframe.close();
}
wireframe.stroke({ width: 0.4, color: [90, 220, 255, 255] });
canvas.add(wireframe);
Same math, same triangles, just one shape instead of ten thousand shapes. First performance lesson of this whole thing, and I wasn’t even looking for it.
An honest ending
This is the dumbest renderer I could possibly write. Every frame it throws everything away and creates around ten thousand shapes, one per face. No depth sorting, no backface culling, no lighting. And still, ThorVG chews through all of that at around 30fps on my machine while I’m doing everything wrong. The web canvas API itself was a smooth experience: shapes, paths, fills, strokes, and it stays out of your way.
There’s an obvious to-do list hiding in that paragraph: keep the shapes alive instead of recreating them, sort the faces by depth, shade them using their normals, cull what the camera can’t see. That’s the next rabbit hole, and I’m looking forward to falling into it.
Update: I fell in. Part 2 shades the station, and the dot and cross products finally earn their keep.
(The demos on this page are capped at 30fps and pause when they’re off screen, so your battery doesn’t pay for my hobby.)
A couple of weeks ago I wrote about relearning computers from the ground up. That post was a promise to learn in public. Consider this the first payment.
The whole thing in one file, if you want to play with it
<html>
    <body>
        <canvas id="canvas" style="background: black"></canvas>
        <script src="https://unpkg.com/@thorvg/[email protected]/dist/webcanvas.js"></script>
        <script src="https://unpkg.com/[email protected]/dist/OBJFile.js"></script>
        <script type="module">
            const WIDTH = 600;
            const HEIGHT = 600;
            const WIREFRAME = false; // flip to true for the wireframe look

            const raw = await fetch(
                "/blog/3d/space_station.obj",
            ).then((res) => res.text());

            const model = new OBJFile(raw).parse().models[0];
            const vertices = model.vertices;
            const faces = model.faces.map(
                (face) => face.vertices.map((v) => v.vertexIndex - 1),
            );

            function project(point3d) {
                return {
                    x: point3d.x / point3d.z,
                    y: point3d.y / point3d.z,
                };
            }

            function toCanvas(point2d) {
                return {
                    x: (point2d.x + 1) * (WIDTH / 2),
                    y: (1 - point2d.y) * (HEIGHT / 2),
                };
            }

            function translateZ(point3d, dz) {
                point3d.z += dz;
                return point3d;
            }

            function rotateXYZ(point3d, angle) {
                const sin = Math.sin(angle);
                const cos = Math.cos(angle);

                let x1 = point3d.x;
                let y1 = point3d.y * cos - point3d.z * sin;
                let z1 = point3d.y * sin + point3d.z * cos;

                let x2 = x1 * cos + z1 * sin;
                let y2 = y1;
                let z2 = z1 * cos - x1 * sin;

                return {
                    x: x2 * cos - y2 * sin,
                    y: x2 * sin + y2 * cos,
                    z: z2,
                };
            }

            const htmlCanvas = document.querySelector("#canvas");
            htmlCanvas.width = WIDTH;
            htmlCanvas.height = HEIGHT;

            const TVG = await ThorVG.init({
                renderer: "gl",
                locateFile: (file) =>
                    `https://unpkg.com/@thorvg/[email protected]/dist/${file}`,
            });

            const canvas = new TVG.Canvas("#canvas", {
                width: WIDTH,
                height: HEIGHT,
            });

            function drawFace(p1, p2, p3) {
                const face = new TVG.Shape();
                face.moveTo(p1.x, p1.y);
                face.lineTo(p2.x, p2.y);
                face.lineTo(p3.x, p3.y);
                face.close();
                face.fill(255, 255, 255, 255);
                canvas.add(face);
            }

            let angle = 0;
            function render() {
                angle += 0.01;
                canvas.remove();

                const points = vertices.map((v) =>
                    toCanvas(project(translateZ(rotateXYZ(v, angle), 15))),
                );

                if (WIREFRAME) {
                    // every face becomes a sub-path of ONE shape
                    const wireframe = new TVG.Shape();
                    for (const [i1, i2, i3] of faces) {
                        wireframe.moveTo(points[i1].x, points[i1].y);
                        wireframe.lineTo(points[i2].x, points[i2].y);
                        wireframe.lineTo(points[i3].x, points[i3].y);
                        wireframe.close();
                    }
                    wireframe.stroke({
                        width: 0.4,
                        color: [90, 220, 255, 255],
                    });
                    canvas.add(wireframe);
                } else {
                    for (const [i1, i2, i3] of faces) {
                        drawFace(points[i1], points[i2], points[i3]);
                    }
                }

                canvas.update();
                canvas.render();
                requestAnimationFrame(render);
            }
            requestAnimationFrame(render);
        </script>
    </body>
</html>